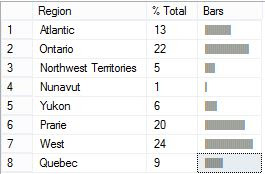
SQL Bars?
While browsing through some SQL puzzles, I came across one where it asked to create a bar chart inside SQL server.
Initial thought - It will require some sort of text manipulation.
But before that I need to structure the data in proper format.
Input Table:-
- Get regions and their total quantities.
- Because total quantities would be huge, it will not be possible to plot them as bars.
Therefore, convert those quantities into percentage of total value. - Create bars for percentage of total value against each region.
with cte as
(
select Region, sum(Order_Quantity) as Quantity,
sum(SUM(Order_Quantity)) over () as [Total Quantity],
round(
(
CAST(
sum(Order_Quantity) as float ) / cast  (sum(sum(Order_Quantity)) over () as float )
) * 100
,0)
 as [% Total]
from superstore
group by Region
)
select Region, [% Total],
REPLICATE('|',[% Total]) as [Bars]
from cte
Output Table:-Just to add final thought, will you ever use this in your real data analysis? Probably not.
But is it fun to do? Absolutely!


Comments
Post a Comment