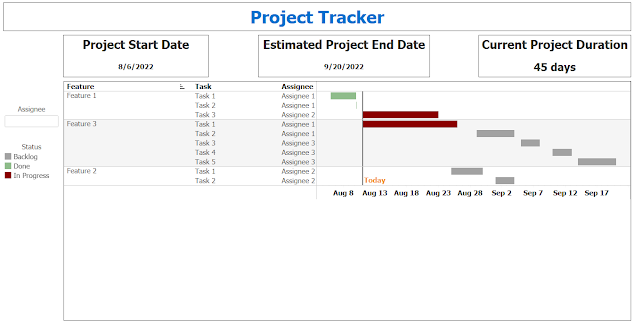
While working on a recent project I have to come up with a way to schedule and maintain tasks and timelines. Very first chart that came to mind was Gantt Chart. A Gantt chart is a type of bar chart that illustrates a project schedule, named after its popularizer, Henry Gantt, who designed such a chart around the years 1910–1915. Modern Gantt charts also show the dependency relationships between activities and the current schedule status. As we all do regarding any project management activity, I tried to implement it in excel first. But there's no default option to create Gantt chart. With some calculations and lots of conditional formatting I was able to create one but refrained from using it because of two reasons:- It's not a centralized solution where anyone from team can lookup status of the project. Every time there's some change in schedule you have to update the tracker and then share it with everyone, who might in turn share it with someone else without keeping ev...

