The power of your passport
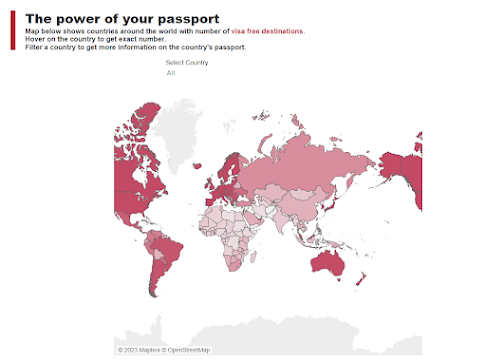
For makeover Monday I created this visualization to showcase how passports for different countries are ranked. Developed countries with better GDP enjoy more visa free destinations than other countries. One might say there is a positive correlation between countries’ GDP and number of visa free destinations. Singapore ranks #1 with Japan coming at #2, while Afghanistan and Syria rank at bottom. Interactive Version Tool Used: Tableau