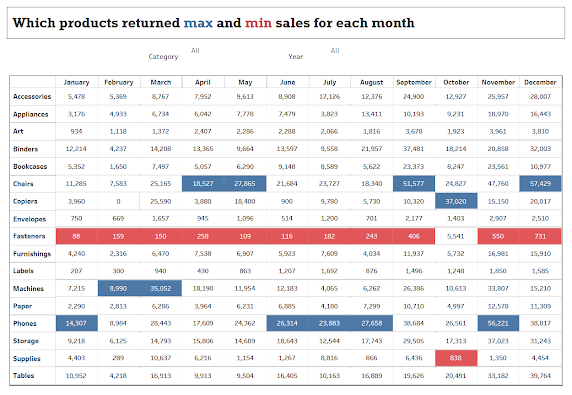
Which of my products returned max and min sales?
This crosstab visualization provides details on most in demand product and least sold product for each month. User can use this information to detect a pattern and better plan their inventory. Use category and year filter to further drill down on chart.
Tool Used:- Tableau


Comments
Post a Comment